
Skills
chart-review-rules
A Claude Code skill with about 70 rules for making and reviewing charts, dashboards and weekly reports. It asks who reads the page and what the data is before building, states only what the data shows, and leaves causes and actions to you.
Helps with
- Turning a CSV into a chart that makes one clear point
- Reviewing a dashboard rule by rule, with a fix for each fault
- Keeping a weekly report in the same shape every week
Before
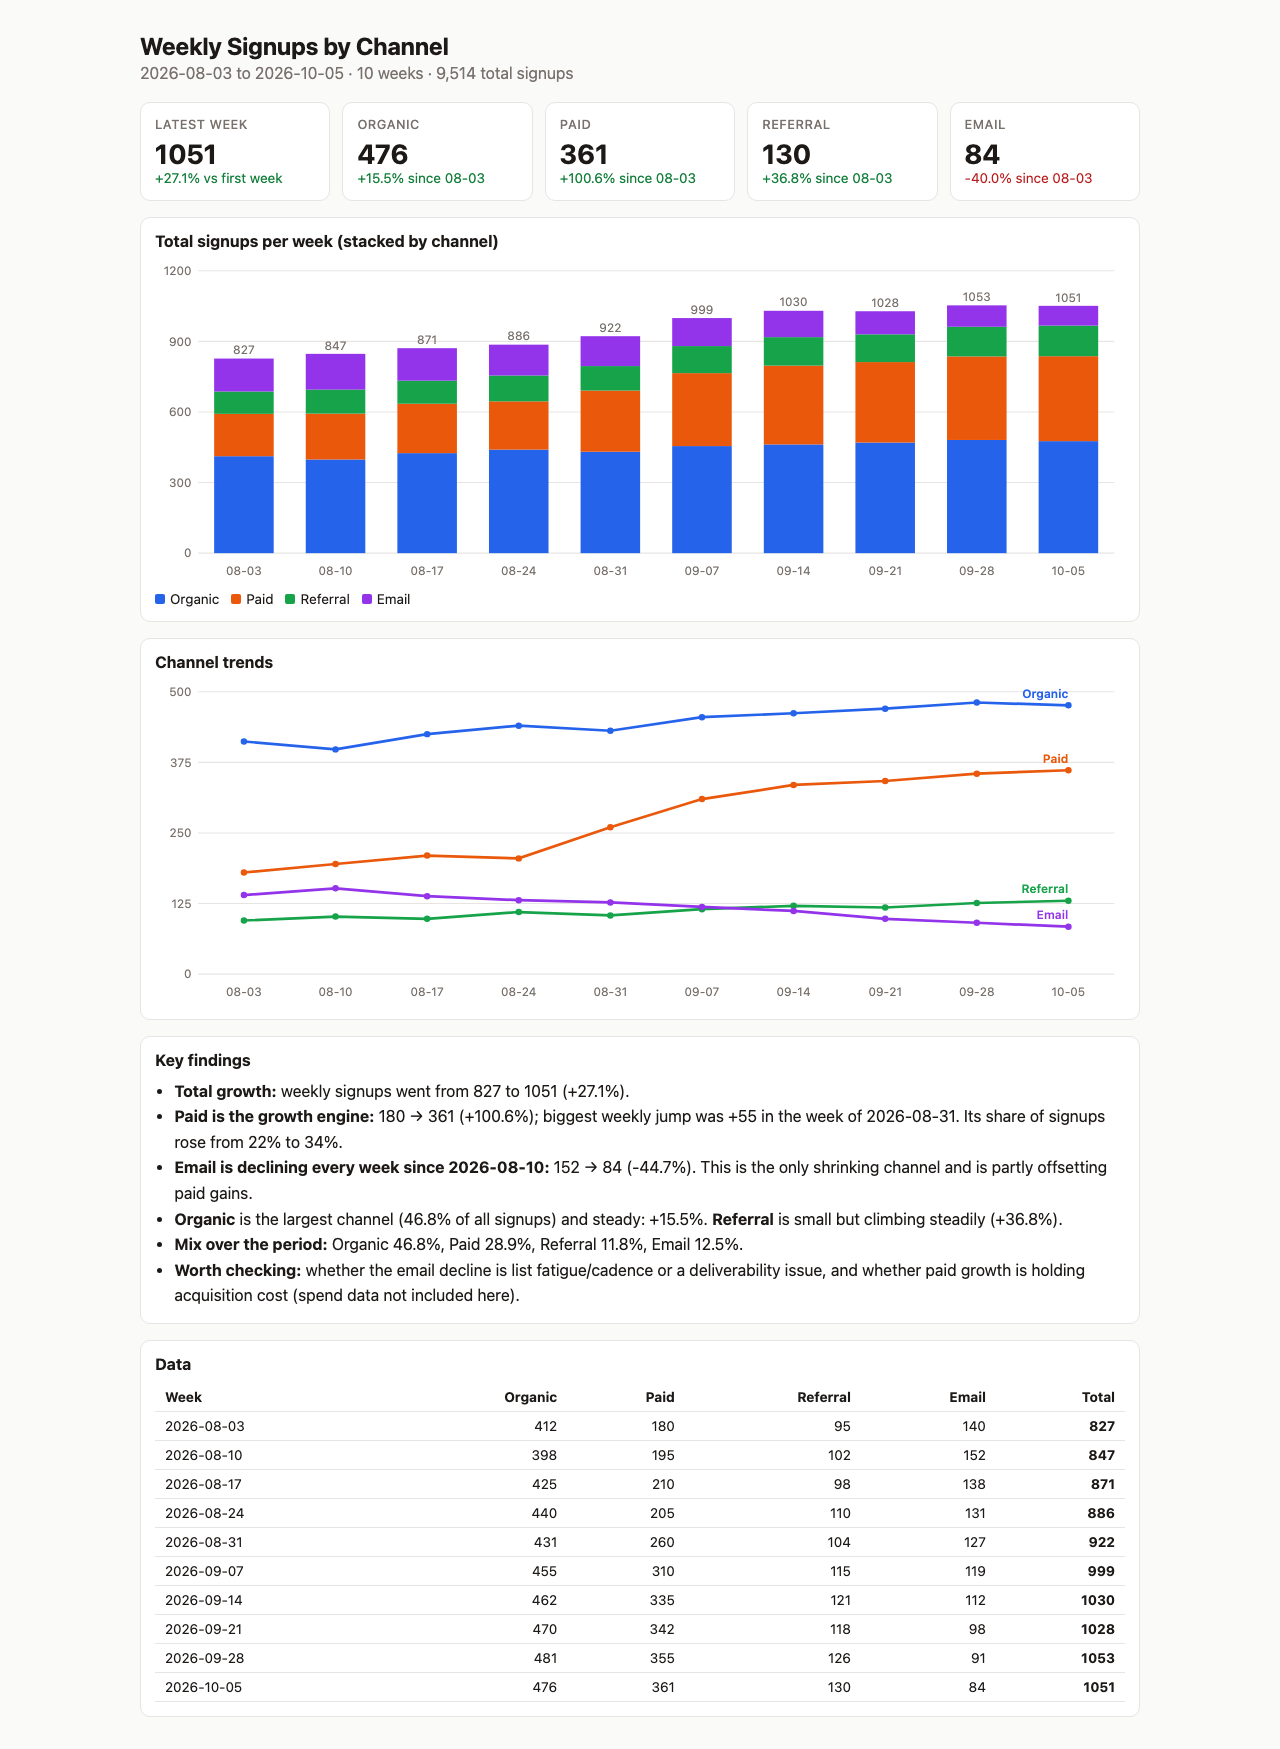
What the user typed
This is our weekly signups data by channel (signups.csv). Help me analyze it and create a dashboard. Save it as report.html.
After
What the user typed
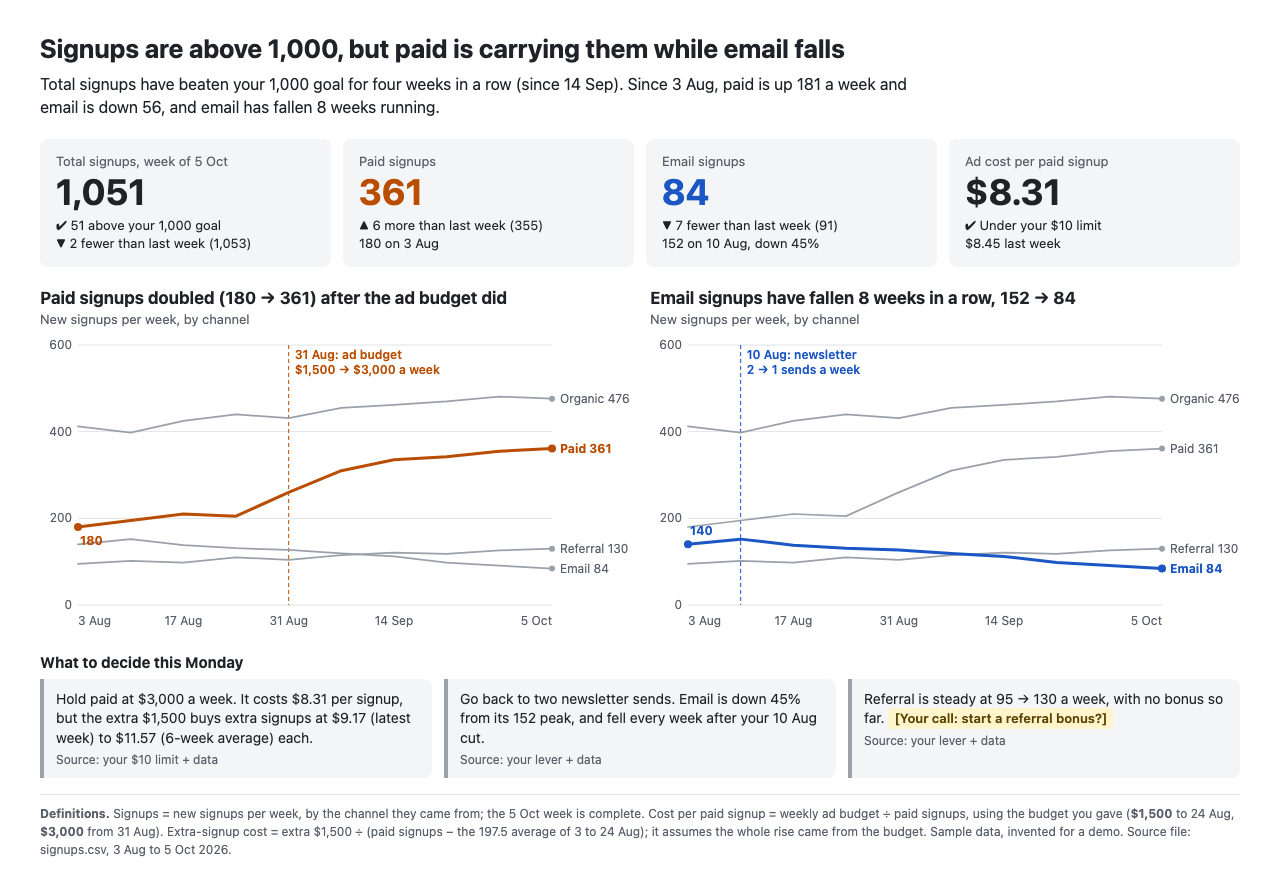
This is our weekly signups data by channel (signups.csv). Help me analyze it and create a dashboard. Save it as report.html.
What the skill asked, and the answers
Claude: I read signups.csv: 10 weekly rows, 3 Aug to 5 Oct 2026, with new signups in 4 channels (organic, paid, referral, email). Correct me if I've misread any of it.
Claude: I can't tell the reasons from the file, so I need four answers before I build the dashboard. (1) Who will read this, and what will they decide afterwards? (2) Are these new signups per week, and where do they come from? Is the 5 Oct week a full week? (3) Was there a paid campaign or budget change around 31 Aug, a change to the email program, or a tracking change? (4) What counts as good here, such as a target or a normal range, and which levers can the reader actually pull?
You: That's right. (1) Me, the owner of a small online shop. I read it every Monday in about five minutes and decide next week's ad budget and email plan. (2) Yes, new signups per week, by the channel they came from. It's sample data, invented for a demo. The 5 Oct week is complete. (3) We raised the paid ad budget from $1,500 to $3,000 a week from the week of 31 Aug. On 10 Aug we cut the newsletter from two sends a week to one, to save time. Nothing else changed, and no tracking changes. (4) More signups is better. I want at least 1,000 a week in total, and a paid signup is worth it under $10. I can change the ad budget any week, go back to two newsletter sends, or start a referral bonus.
cp -r chart-review-rules ~/.claude/skills/
Ideas from Cole Nussbaumer Knaflic, Storytelling with Data (Wiley, 2015), in our own words. Nothing quoted. The book covers the call to action, the main point in one sentence and titles that state the point; the summary block, actions and warning flags are our additions.